> For the complete documentation index, see [llms.txt](https://docs.vdo.ninja/llms.txt). Markdown versions of documentation pages are available by appending `.md` to page URLs; this page is available as [Markdown](https://docs.vdo.ninja/guides/stats-menu.md).

# The stats panel

Every VDO.Ninja video has a live statistics panel behind it. It is the fastest way to answer questions that otherwise turn into guesswork: does the evidence point to the network or the encoder, is audio being sent, and is the bitrate you asked for the bitrate you are getting.

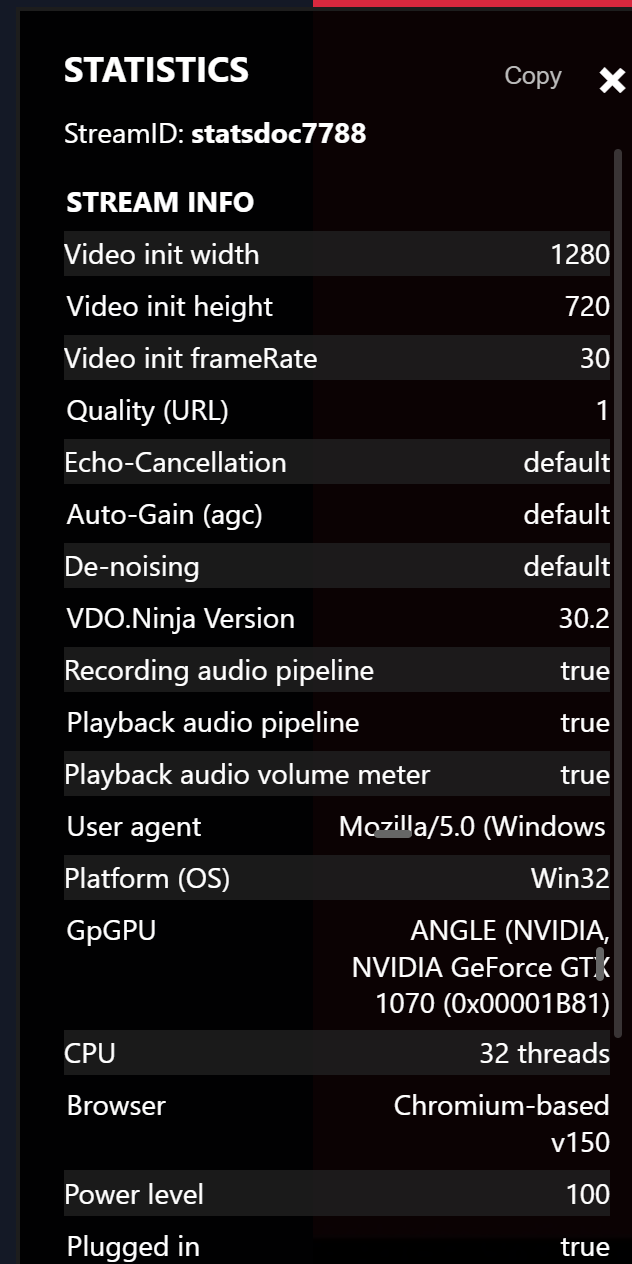
<figure><img src="/files/xK6O2OQwSPGP8pCFEHTL" alt="The Statistics panel showing the stream ID and the Stream Info section"><figcaption><p>The stats panel on the viewing side. The header stays fixed while the list below it scrolls.</p></figcaption></figure>

## Opening it

**Ctrl + click** on any video (**Cmd + click** on macOS). Ctrl + click the same video again to close it.

There are three other ways in:

* **Right-click a video** and choose *Show Stats* from the context menu.
* **Click the connection readout** in the top-right of the header on a publishing page. That opens your own outbound stats.
* **On a phone or tablet**, tap the video five times in quick succession. Each tap has to land within half a second of the last one, and the sequence resets if you pause.

<figure><img src="/files/qZL6SMzgv81r6EB1hBDq" alt="Header readout showing connection count, audio streams, video streams and upload bitrate"><figcaption><p>The header readout on a publishing page: connections, outbound audio streams, outbound video streams, and total upload bitrate. Click it to open your stats.</p></figcaption></figure>

Press **Escape** to close the panel, or use the **✕** in its top-right corner.

## There are two different panels

Which panel you get depends on which video you clicked, and they show different things. This trips people up constantly, so it is worth being explicit:

| You clicked             | You get                                                      | It tells you                                                                    |
| ----------------------- | ------------------------------------------------------------ | ------------------------------------------------------------------------------- |
| A remote guest's video  | [The viewer panel](/guides/stats-menu/viewer-stats.md)       | What is arriving at **your** machine, and what the sender says about themselves |
| Your own camera preview | [The publisher panel](/guides/stats-menu/publisher-stats.md) | What **you** are sending, broken down per connected viewer                      |

A useful consequence: if a guest looks bad to you, their publisher panel and your viewer panel describe the same connection from opposite ends. Comparing the two can separate a capture or encoder constraint from a problem on that peer-to-peer path. It cannot, by itself, prove whether packet loss occurred on the sender's uplink, the receiver's downlink, or somewhere in transit.

## Panel controls

* **Copy** puts the entire panel on your clipboard as readable text. This is what you want when asking for help — see [asking an AI to read your stats](/guides/stats-menu/llm-prompt.md).
* The numbers refresh every 3 seconds by default.
* Refreshing pauses while you are dragging a slider or have text selected inside the panel, so you can select and copy a single value without it disappearing.

Only one panel is open at a time. Ctrl + clicking a second video replaces the panel rather than opening another one, so to compare two guests you need to capture one with **Copy** before switching to the other.

## URL parameters

| Parameter                | Effect                                                              |
| ------------------------ | ------------------------------------------------------------------- |
| `&stats`                 | Opens the stats panel automatically as soon as a connection is made |
| `&nostats` or `&stats=0` | Disables the panel entirely, and hides it from the right-click menu |
| `&statsinterval=1000`    | Refresh interval in milliseconds. The minimum is 250                |

`&nostats` is worth knowing about for kiosk-style or public-facing scenes, since the panel exposes the machine details of whoever is on the other end.

## The 60-second triage

If you only remember one thing from this guide, remember this table. Open the panel on the **receiving** side and read four numbers.

| What you see                             | What it usually means                                                                           | Where to go next                                                                                       |
| ---------------------------------------- | ----------------------------------------------------------------------------------------------- | ------------------------------------------------------------------------------------------------------ |
| **Packet Loss** above \~1%               | Network congestion or a weak link somewhere on the path                                         | [Diagnosing problems](/guides/stats-menu/troubleshooting.md#video-is-blocky-soft-or-keeps-freezing)    |
| **Bitrate** far below what you asked for | The sender cannot push more, or is being told not to                                            | [Diagnosing problems](/guides/stats-menu/troubleshooting.md#the-bitrate-is-far-lower-than-i-asked-for) |
| **Candidate type** says `relay`          | Traffic is going through a TURN relay, which may add latency or encounter relay capacity limits | [Diagnosing problems](/guides/stats-menu/troubleshooting.md#the-connection-is-using-a-relay)           |
| **Quality limited by** says `cpu`        | The sender's machine cannot encode fast enough                                                  | [Diagnosing problems](/guides/stats-menu/troubleshooting.md#cpu-is-the-bottleneck-on-the-sending-side) |

These four are useful starting points. The surrounding fields provide the context needed before treating any one reading as a diagnosis.

## What "good" looks like

For a healthy 1080p30 connection between two well-connected machines:

```
Packet Loss           0 %
Round Trip Time       under 100 ms
Candidate type        stable path; direct when available
Quality limited by    none
FPS                   within 1-2 of the sender's capture rate
Jitter Buffer Delay   under ~100 ms
Bitrate               sufficient for the desired quality
```

None of these are hard thresholds. A 200 ms round trip is completely normal between continents, and 1% packet loss on a cellular uplink may be a good result. An encoder may also stay below its target on a static or low-detail scene because it does not need the extra bits. Read the fields as a relative picture, and compare against the same stream when it *was* behaving.

## Pages in this guide

* [Reading the viewer panel](/guides/stats-menu/viewer-stats.md) — every field on the receiving side
* [Reading the publisher panel](/guides/stats-menu/publisher-stats.md) — every field on the sending side
* [Diagnosing problems](/guides/stats-menu/troubleshooting.md) — symptom-first recipes
* [Asking an AI to read your stats](/guides/stats-menu/llm-prompt.md) — a copy-paste prompt that teaches an LLM what these numbers mean

## Related reading

* [How to control bitrate/quality](/guides/how-do-i-control-bitrate-quality.md)
* [Stable IRL streaming](/guides/irl-streaming-stability.md)
* [Video bitrate for push/view links](/guides/video-bitrate-for-push-view-links.md)
* [Handling guest disconnects and connection recovery](/guides/handling-guest-disconnects-and-connection-recovery.md)
* [`&showconnections`](/advanced-settings/settings-parameters/and-showconnections.md) — puts the viewer count on the video itself, without opening the panel
* [`&maxconnections`](/advanced-settings/settings-parameters/and-maxconnections.md) — caps how many viewers a source will accept


---

# Agent Instructions
This documentation is published with GitBook. GitBook is the documentation platform designed so that both humans and AI agents can read, navigate, and reason over technical content effectively. Learn more at gitbook.com.

## Querying This Documentation
If you need additional information that is not directly available in this page, you can query the documentation dynamically by asking a question.

Perform an HTTP GET request on the current page URL with the `ask` query parameter, and the optional `goal` query parameter:

```
GET https://docs.vdo.ninja/guides/stats-menu.md?ask=<question>&goal=<endgoal>
```

`ask` is the immediate question: it should be specific, self-contained, and written in natural language.
`goal` is optional and describes the broader end goal you are ultimately trying to accomplish on behalf of the user. GitBook uses it to tailor the answer towards what is most useful for that goal.

The response will contain a direct answer to the question and relevant excerpts and sources from the documentation.

Use this mechanism when the answer is not explicitly present in the current page, you need clarification or additional context, or you want to retrieve related documentation sections.
